K-Means Clustering and Hierarchical Document Clustering on the Most Popular Tweets of US Congresspeople
Introduction: In class, we spent time discussing methods of classification including Naive Bayes and Decision Trees. In this project, we were instead interested in methods for performing clustering on text using machine learning tools. In “Topical Clustering of Tweets,” (2011) [1] researchers at the Language Technologies Institute of Carnegie Mellon University suggest that traditional methods for clustering can often be “incoherent from a topical perspective” when applied to Tweets in particular. With this in mind, we wanted to see for ourselves what we could learn about communities on Twitter using document clustering methods. So, we decided to acquire the Tweets of all known Twitter accounts owned by members of the 115th United States Congress (the House of Representatives and Senate), and determine the similarities between those individuals based on the topics discussed through their accounts. We wanted to use machine learning methods to help us identify the political alliances held between congresspeople. To limit the size of our training data, we focused exclusively on the most “liked” or “favorited” Tweet acquired from each congressperson’s account. These Tweets were tokenized, stemmed, and then vectorized using TF-IDF. Finally, we clustered the Tweets into 5 distinct clusters using the K-Means clustering algorithm, which we then visualized spatially in both two and three dimensions. Then, we applied hierarchical document clustering to the Tweets to represent specific relationships between accounts and visualized these relationships using dendrograms.
Methods: Using a CSV file provided by the Social Feed Manager project [2], and also adapting a Twitter web-scraping Python script from the Trump Tweets project [3], we downloaded all the Tweets from all known accounts of members of the United States 115th Congress. Ultimately, this excluded only 12 congresspeople (or just over 2%), all of whom were members of the House of Representatives. We managed this data using the Pandas package for the Python programming language. In the entire dataset acquired, there were 1,614,703 individual Tweets from all the accounts. This data acquisition was performed over the night of November 30th, 2017, and there are surely more Tweets to be downloaded at this time. Initially, we tried using all the Tweets which were available to us, however we decided to limit the size of our dataset by only using the single most “favorited” or “liked” Tweet from each account. This acted as a metric of civilian engagement. While we were interested to see how the language used by congresspeople shows their political affiliations and alignments with one another, this shift allowed us to process through our data more quickly and more importantly it let us reframe our interest as particularly addressing how American civilians using the social networking website Twitter recognize or relate to the congresspeople who represent them. Essentially, what could an uninformed American civilian know about the things their congresspeople care about most, and what do these particularly far-reaching and well-received objects of care show about the similarities between those congresspeople? Thus, we used a list of stop words [4] and a Tweet tokenizer [5] provided by Python’s Natural Language Toolkit (NLTK) package [6] to clean the data. We removed URLs, “@” mentions of other users, “#” hashtags, all words which did not exclusively contain only alphabetical characters, and also stop words (e.g. “of, the, in, and”). The goal of this cleaning was to distill the data into only descriptive language like nouns, verbs, and adjectives. If congresspeople used similar “#” hashtags to identify themselves within a community of discussion however did not align themselves with the majority ideology of that group, or acted similarly with “@” mentions or URLs, then that information in particular would not necessarily best inform the topics actually discussed. Unfortunately, these identifiers do not actually represent topics well because they are more important to the style of the Tweet than the meaning of it. The presence of a “#” hashtag does not say everything about what a user thinks about that “#” hashtag, the inclusion of an “@” mention does not mean a user in particular is necessarily being addressed, and URLs do not normally carry with them any significant identifier of opinion in particular. Stop words and word which contain non-alphabetical characters are often the same in this regard. By using NLTK’s Snowball Stemmer [7], we were able to approximate the stemmed version of every word in the remaining dataset (e.g. ideally words like “crossing” become like “cross”), which became useful later on for the purpose of identifying topics. It took some trial and error to alter the minimum and maximum document frequencies in the TF-IDF vectorization step, but the topics which were then produced by applying the K-Means clustering algorithm [8] showed that they were reasonably different from one another, and seemed representative of actually relevant topics discussed in politics. We picked 5 clusters arbitrarily. We used multidimensional scaling to reduce the dimensionality of our TF-IDF vectors so we could visualize them along with the ways the accounts associated with their Tweets were clustered. These visualizations were made using Matplotlib [9] and Plotly [10] for Python, the former being for images and the latter being for interactive graphs. Finally, we applied hierarchical document clustering [11] and similarly visualized our results, specifically to show connections between potential clusters.
Results: The majority of our results are best viewed in a web browser in the form of an iPython notebook at this URL.
The first, and perhaps easiest-to-read result we produced is representative of how the K-Means clustering algorithm split up the Tweets which it was set to cluster:
| Cluster | Number of Tweets |
| 5 | 318 |
| 1 | 89 |
| 4 | 45 |
| 2 | 41 |
| 3 | 30 |
To better understand this information we also produced a list of the top 10 most important words for each of our 5 clusters along with the top 5 most associated Twitter accounts of congresspeople associated with each cluster:
Cluster 1 words: american, thank, care, health, families, act, work, tax, lives, great
Cluster 1 top 5 accounts:@CongPalazzo, @RepTomMacArthur, @RepVisclosky, @GKButterfield, @RepOHalleran
Cluster 2 words: trump, president, nation, statement, donald, securing, withdrawing, stand, rights, decision
Cluster 2 top 5 accounts:@RepPeteKing, @RepCheri, @RepLujanGrisham, @LamarSmithTX21, @RepJohnDuncanJr
Cluster 3 words: white, supremacists, house, defended, clear, president, condemn, placed, fine, evil
Cluster 3 top 5 accounts:@RepFredUpton, @HerreraBeutler, @RepEdRoyce, @RepRoybalAllard, @PeteSessions
Cluster 4 words: honor, attend, floor, victims, inauguration, silence, today, donating, blood, house
Cluster 4 top 5 accounts:
@RepMikeCapuano, @jahimes, @RepDavidYoung, @RepWebster, @RepAlGreen
Cluster 5 words: vote, today, congress, supporting, tax, needs, resign, passed, house, laws
Cluster 5 top 5 accounts:@RepRichHudson, @RepCurbelo, @RepTipton, @RepDrewFerguson, @RepRubenGallego
So, the majority of Tweets which were clustered were placed into the fifth cluster. This should not come as a surprise, particularly because these terms of strongly associated with politics in general (i.e. “vote,” “congress,” and “tax”).
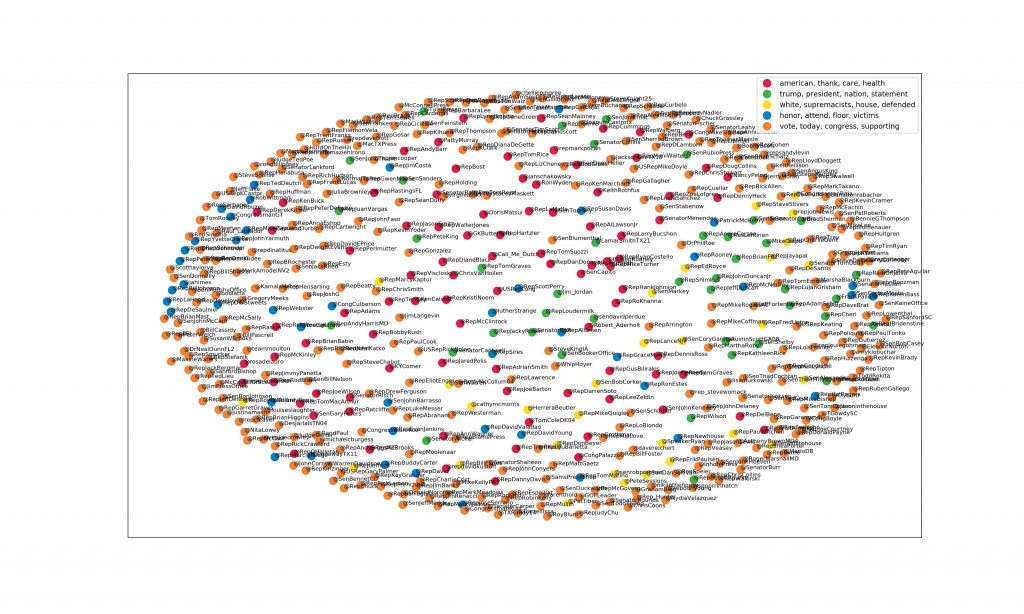
The following figure depicts the TF-IDF vectors of our Tweets dataset reduced in dimensionality down to two dimensions, where each Tweet is identified by its user who sent it and each is labeled with the cluster to which it belongs:
This figure interestingly illustrates the way Tweets belonging to the fifth cluster are organized. This topic in particular seems to have worked as a kind-of catch-all for politics in general. These are the congresspeople whose most popular Tweets were most generic in content. They are grouped together as a border surrounding all the other vectors, which indicates a wide variety of TF-IDF weights to the terms present in those Tweets. For this same result represented in a three-dimensional interactive visualization, see the iPython notebook rendered in HTML.
Our final result is a dendrogram which represents a hierarchical document clustering of the Tweets in our dataset. It is much too long to show in this post, so please visit this link in order to see both the static and interactive versions. We decided to apply hierarchical document clustering to better understand connections between congresspeople. While K-Means shows spatially how close these Tweets were in the clusters to which they were assigned, this method better relates individual Tweets to one another, showing where the connections actually occur that form potential clusters. It is important to note that for some reason we do not fully understand, the visualization produced with Matplotlib shows the same number of clusters as the one produced with Plotly, however the connections held between accounts themselves are different between the two.
Conclusion: We successfully utilized the K-Means clustering algorithm to identify clusters present in our dataset. Our visualizations do not provide objective truths about the relationships between congresspeople, their Tweets, or even their most popular Tweets. Instead, these visualizations raise questions about the congresspeople who represent Americans. This project acts as a kind of starting place for citizens to engage with their representatives and ask why they align themselves with certain ideas, and each other in this manner. We would like to extend this project away from text analysis and towards application of clustering algorithms on geographical data. The manner in which we acquired these Tweets does not make use of the Twitter Application Programming Interface (API) [12] which includes latitude and longitude coordinates. A clustering algorithm like K-Means may be well suited to the problem of identifying the most important locations from which American congresspeople send Tweets. In which cities in the United States are congresspeople, who represent states and territories, residing? How physically far away is our engagement with our representatives?
Note: all files used for this project are available on GitHub at the following URL: https://github.com/segalgouldn/CMSC251-Final-Project
Bibliography:
[1] Rosa, Kevin Dela, et al. “Topical clustering of tweets.” Proceedings of the ACM SIGIR: SWSM (2011).
[2] Gaber, Yonah Bromberg. “A List of Twitter Handles for Members of Congress.” Social Feed Manager. Social Feed Manager, 23 May 2017. Web.
[3] Sashaperigo. “Sashaperigo/Trump-Tweets.” GitHub. GitHub, 31 July 2016. Web. 22 Dec. 2017.
[4] “Nltk.corpus Package.” Nltk.corpus Package — NLTK 3.2.5 Documentation. N.p., n.d. Web. 22 Dec. 2017.
[5] “Nltk.tokenize Package.” Nltk.tokenize Package — NLTK 3.2.5 Documentation. N.p., n.d. Web. 22 Dec. 2017.
[6] “Natural Language Toolkit.” Natural Language Toolkit — NLTK 3.2.5 Documentation. N.p., n.d. Web. 22 Dec. 2017.
[7] “Nltk.stem Package.” Nltk.stem Package — NLTK 3.2.5 Documentation. N.p., n.d. Web. 22 Dec. 2017.
[8] “Sklearn.cluster.KMeans.” Sklearn.cluster.KMeans — Scikit-learn 0.19.1 Documentation. N.p., n.d. Web. 22 Dec. 2017.
[9] “Introduction.” Matplotlib: Python Plotting — Matplotlib 2.1.1 Documentation. N.p., n.d. Web. 22 Dec. 2017.
[10] “Modern Visualization for the Data Era.” Plotly. N.p., n.d. Web. 22 Dec. 2017.
[11] “Hierarchical Clustering (scipy.cluster.hierarchy).” Hierarchical Clustering (scipy.cluster.hierarchy) — SciPy V1.0.0 Reference Guide. N.p., n.d. Web. 22 Dec. 2017.
[12] “Docs – Twitter Developers.” Twitter. Twitter, n.d. Web. 22 Dec. 2017.

